Vectorization in R is a great way to optimize your code by applying a function simultaneously to all elements in a vector or matrix. Here's a basic code snippet that demonstrates this concept. We'll use the sqrt() function, which computes the square root of a number, and apply it to a vector of numbers.
# Define a vector of numbers
numbers <- c(1, 4, 9, 16, 25)
# Compute the square root of all numbers in the vector
sqrt_numbers <- sqrt(numbers)
# Print the square roots
print(sqrt_numbers)
Here’s what you get:

Conveniently, R calculates and prints the square roots of all numbers in your vector.
Vectorization is a powerful feature of R, and many built-in functions are already vectorized. This is much faster and efficient than using a loop to iterate over the elements. It is especially beneficial when dealing with large data sets.
Now let's apply this to a more real-life use case: Assume you're a data analyst at a pharmaceutical company and you have a data frame with information about a large number of drugs. One of the variables is the dosage in milligrams (mg), and you want to convert this to grams (g) for all drugs. Using a vectorized approach, you can do this easily and efficiently:
# Define a data frame with drug information
drug_data <- data.frame(
drug_name = c("Drug1", "Drug2", "Drug3", "Drug4", "Drug5"),
dosage_mg = c(500, 1000, 1500, 2000, 2500)
)
# Convert dosage from mg to g
drug_data$dosage_g <- drug_data$dosage_mg / 1000
# Print the updated data frame
print(drug_data)
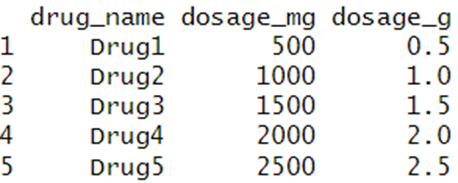
Here are the results:

As you can see, the dosage_g column has been calculated for all rows in a single operation, without the need for any loops. This is the power of vectorization in R!
BridgeText can help you with all of your statistical analysis needs.


