Here is a simple example of how to use Python to conduct a binomial probability test.
Binomial probability test is appropriate when you are dealing with binary outcomes (i.e., something either happens or it doesn't) and you want to determine the probability of a certain number of successes given a certain number of trials.
Let's say, for example, you are flipping a fair coin 10 times, and you want to know the probability of getting exactly 5 heads.
We'll use the scipy.stats.binom module, which implements the binomial distribution functions.
Here's the Python code:
from scipy.stats import binom
# total number of trials
n = 10
# number of successes (heads)
k = 5
# probability of success on each trial (for a fair coin, this is 0.5)
p = 0.5
# calculate the binomial probability
prob = binom.pmf(k, n, p)
print("The probability of flipping a coin 10 times and getting exactly 5 heads is: ", prob)
Here is the answer:

Thus, if you run this code, it will output the exact probability of getting 5 heads when flipping a coin 10 times.
Note that the function binom.pmf(k, n, p) is used to calculate the "probability mass function", which gives the probability of a specific number of successes in a given number of trials for a binary outcome with a given success probability.
In real-world problems, the binomial test is used for a variety of situations where outcomes are binary, like testing conversion rates in marketing campaigns (conversion or no conversion), success rates in medical trials (recovery or no recovery), etc.
Keep in mind that assumptions of the binomial distribution need to be met: each trial is independent of the others, there are only two possible outcomes, and the probability of success is the same for each trial. If these assumptions do not hold, other statistical techniques might be more appropriate.
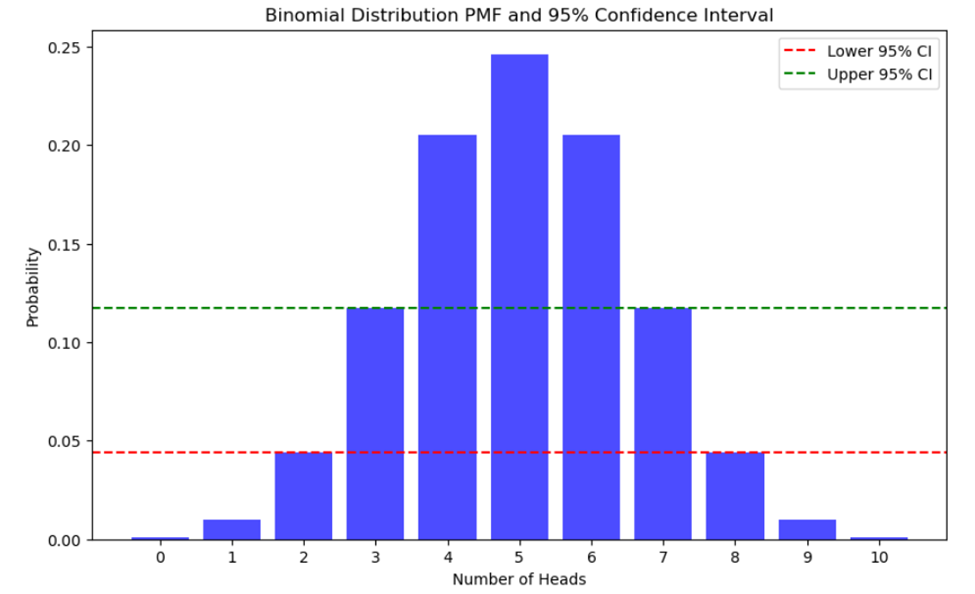
Now let’s visualize these results.
Generating a 95% confidence interval plot for a binomial distribution like our coin flip example can be achieved using matplotlib and numpy libraries. We will create a bar plot, where each bar's height represents the probability of getting a certain number of "heads" in 10 coin tosses. The 95% confidence interval will be represented by horizontal lines.
Here's how you can do it:
import numpy as np
import matplotlib.pyplot as plt
from scipy.stats import binom
# number of trials and probability of success
n = 10
p = 0.5
# range of number of successes
x = np.arange(0, n+1)
# probabilities for each number of successes
probs = binom.pmf(x, n, p)
# cumulative probabilities
cum_probs = binom.cdf(x, n, p)
# find the lower and upper bounds of the 95% confidence interval
lower = x[np.where(cum_probs >= 0.025)[0][0]]
upper = x[np.where(cum_probs <= 0.975)[0][-1]]
# plot the probabilities as a bar plot
plt.figure(figsize=(10,6))
plt.bar(x, probs, color='blue', alpha=0.7)
plt.xticks(x)
plt.xlabel('Number of Heads')
plt.ylabel('Probability')
# plot the 95% confidence interval
plt.axhline(y=probs[lower], color='r', linestyle='dashed', label='Lower 95% CI')
plt.axhline(y=probs[upper], color='g', linestyle='dashed', label='Upper 95% CI')
plt.legend()
plt.title('Binomial Distribution PMF and 95% Confidence Interval')
plt.show()
Here’s what you get:

BridgeText can help you with all of your statistical analysis needs.


.jpg)


