To run an analysis of variance (ANOVA) and Tukey's test in Python, we'll need to make use of the scipy and statsmodels libraries. Please note, you'd have to install these libraries if they aren't already installed. Here is a coded example:
import numpy as np
import pandas as pd
import scipy.stats as stats
import statsmodels.api as sm
from statsmodels.formula.api import ols
from statsmodels.stats.multicomp import pairwise_tukeyhsd
# Let's say we have a dataset 'df' with a categorical column 'Group' and a numerical column 'Values'
df = pd.DataFrame({
'Group': np.repeat(['A', 'B', 'C'], 20),
'Values': np.concatenate([np.random.normal(5, 1, 20), np.random.normal(6, 1, 20), np.random.normal(7, 1, 20)])
})
# Conduct one-way ANOVA
model = ols('Values ~ C(Group)', data=df).fit()
anova_table = sm.stats.anova_lm(model, typ=2) # Type 2 ANOVA DataFrame
print(anova_table)
# Conduct Tukey's test
tukey = pairwise_tukeyhsd(endog=df['Values'], groups=df['Group'], alpha=0.05)
print(tukey)
Here’s what you get:

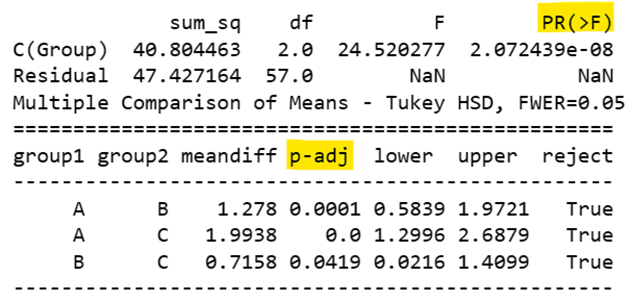
Highlighted above are the two p values you need to consult. PR(>F) is where Python records the statistical significance of the ANOVA, which, if below .05, is significant. Here, p is much smaller than .05, so the ANOVA is significant. However, this does not tell you which group is significantly different from which other group. Here, you need to consult p-adj. Wherever this number is < .05, the pairwise comparison is significant. Therefore,
- The mean of A is larger than the mean of B, because p = .0001, and the mean difference is positive.
- The mean of A is larger than the mean of C, because p < .0001, and the mean difference is positive.
- The mean of B is larger than the mean of C, because p = .0419, and the mean difference is positive.
In order to run an ANOVA, you need to ensure that data are normally distributed. Let’s look at the normality for A, B, and C using the Shapiro-Wilk test:
# Split the groups
group_a = df['Values'][df['Group'] == 'A']
group_b = df['Values'][df['Group'] == 'B']
group_c = df['Values'][df['Group'] == 'C']
# Perform Shapiro-Wilk test
w_a, p_value_a = stats.shapiro(group_a)
w_b, p_value_b = stats.shapiro(group_b)
w_c, p_value_c = stats.shapiro(group_c)
# Print results
print(f"Group A: W={w_a}, p-value={p_value_a}")
print(f"Group B: W={w_b}, p-value={p_value_b}")
print(f"Group C: W={w_c}, p-value={p_value_c}")
Here’s what you get:

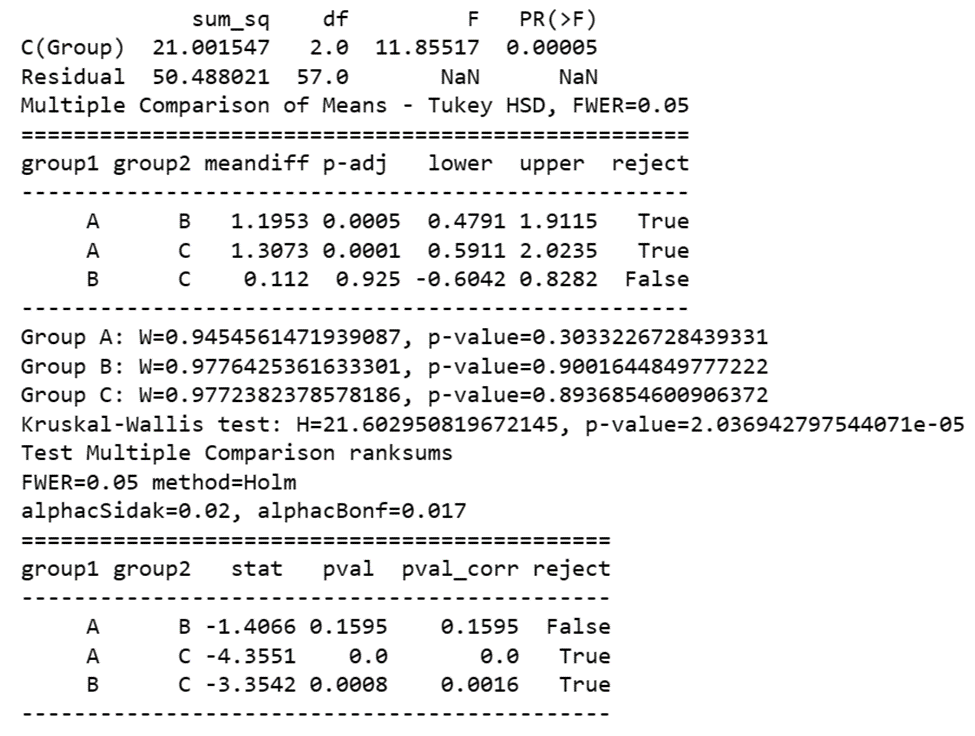
In the output, a W close to 1 and a large p-value (e.g., > 0.05) for each group would suggest that the null hypothesis (the data came from a normal distribution) should not be rejected. If, for example, all of your groups had non-normal distributions, then, in Python, you could perform non-parametric one-way ANOVA using the Kruskal-Wallis test from the scipy library. However, there is no direct equivalent to Tukey's test for non-parametric data. Instead, we often use post-hoc pairwise comparisons with a correction for multiple tests, such as the Dunn's test. Here's an example of code:
import numpy as np
import pandas as pd
import scipy.stats as stats
from statsmodels.stats.multicomp import MultiComparison
# Let's say we have a dataset 'df' with a categorical column 'Group' and a numerical column 'Values'
df = pd.DataFrame({
'Group': np.repeat(['A', 'B', 'C'], 20),
'Values': np.concatenate([np.random.normal(5, 1, 20), np.random.normal(6, 1, 20), np.random.normal(7, 1, 20)])
})
# Conduct Kruskal-Wallis test
h, p_value = stats.kruskal(df['Values'][df['Group'] == 'A'],
df['Values'][df['Group'] == 'B'],
df['Values'][df['Group'] == 'C'])
print(f"Kruskal-Wallis test: H={h}, p-value={p_value}")
# If p-value is significant, perform post-hoc pairwise comparisons with Dunn's test
if p_value < 0.05:
# MultiComparison class requires statsmodels 0.10.0 or higher
mc = MultiComparison(df['Values'], df['Group'])
result = mc.allpairtest(stats.ranksums, method='Holm')
print(result[0]) # result[0] gives the summary of tests
Here’s what you get:

Thus, you can generate non-parametric ANOVA results and the equivalent of a Tukey’s test for non-parametric conditions in Python.
BridgeText can help you with all of your statistical analysis needs.


